About the Waveforms Display
What is a Drum Recorder?
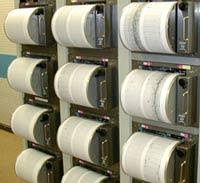
Drum recorders, like the ones pictured here, draw a seismogram on a piece of paper wrapped around a slowly revolving drum. As the drum revolves, the pen shifts across it, making a big spiral or helical record that eventually fills the entire page. When the paper is removed and laid flat, the record appears to be many horizontal lines, like lines in a book. These mechanical recorders, popular 40 years ago, have been replaced by computers, which digitize the data at the source and store it in digital form. The digital data can then be displayed in a variety of ways by the computer. Here, we've displayed the data to look like the old-fashioned paper records that drum recorders produced. Pictured here are Helicorders®, a common type of drum recorder, manufactured by Geotech Instruments, LLC.
How to Read the Display
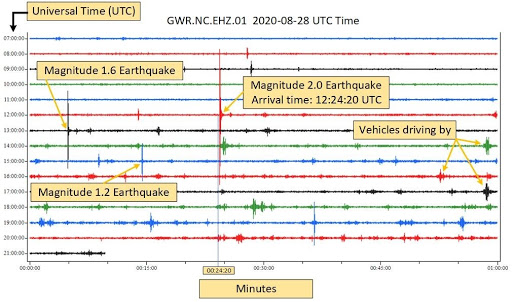
Each waveform window is a record of how the ground moved at a particular seismograph or geodetic station in northern California during a 24-hour period. The plots are "magnified" according to the level of background or ambient seismic noise, which is generated by wind, cultural disturbances and anything else that makes the ground shake. Thus, some sites appear noisier than others. The seismogram is "read&quit; like a book, from left to right and top to bottom (this is the direction that time increases). As with a book, the right end of any horizontal line "connects" with the left end of the line below it. Each line represents 60 minutes of data; one line per hour. The colors of the horizontal lines have no particular significance; they are used to make it easier to distinguish lines from one another and to make it easier to recognize at which hour of data you are looking. Time is indicated on the left in Universal (or Greenwich) time, and on the right in local Pacific time. At the top of the window, the bar scale shows the scaling of the vertical amplitude of the data (wiggles) in millimeters for geodetic data, cm/s for velocity seismic data, and cm/s2 for acceleration seismic data.
Interpretation
When an earthquake occurs the seismogram will show ground motions that typically last from several tens of seconds to many minutes, depending on the size of the earthquake and the sensitivity of the seismograph. The height of the recorded waves on the seismogram (wave amplitude) is a greatly magnified representation of the actual ground motion. A recording of an earthquake has recognizable characteristics. First, if the earthquake is nearby the sensor site, the energy onset is impulsive and high amplitude. Next, you can often recognize the arrival of different wave types: P (the fastest traveling waves), S (shear waves), and surface waves. On these waveform plots you may see earthquakes of any size in northern California, moderate sized earthquakes (M4+) from elsewhere on the west coast, and larger earthquakes (M6+) from around the world. Visit https://earthquake.usgs.gov/ for a map and list of current earthquakes to see if you can match up an earthquake you see here.
Not all the wiggles seen on the seismograms are due to earthquakes. Anything that produces ground vibrations could be recorded. Examples of naturally occuring signal noise are wind, rain, ocean waves, and thunder. Examples of “cultural” noise are vehicle traffic, trains, factories, air conditioning units, and generators. Furthermore, malfunctioning equipment and radio interference can corrupt the signal and also show up on the seismogram. Fortunately, these other sources of noise generally have their own waveform signature that can be distinguished from earthquakes.
Illustrative Examples of earthquake and other sources of ground shaking:
- From USGS
- From Berkeley Seismo Lab (local quake)
- (regional quake)
- (teleseismic quake)
How the Data Channels are Named
After selecting a station from the map, list, or table, you will be further prompted to select which channel you wish to view. Modern seismic and geodetic stations record multiple channels of data. The different channels correspond to different sensors, the orientation of the sensor (typically North-South, East-West, or up-down), and different recording parameters such as gain or sample rate. Each channel has a unique name from every seismic station around the world, and identifies the characteristics of the channel. Each data channel has a four part code such as GRIZ.BK.HNZ.00, where the four parts are called the station code, network code, component code, and location code respectively.
Station Code
The station code is the name of the station. The code is usually a reflection of the station name given by the station operator, which is usually named for a nearby geographic feature. In this example, GRIZ is the code for Grizzly Peak.
Network Code
The second part identifies the regional seismic network that operates the station. The waveforms available here are from these network operators:
- BK, BP Seismic networks operated by UC Berkeley
- BARD Geodetic network operated by UC Berkeley
- CE Seismic network operated by the California Geological Survey
- NC, NP Seismic networks operated by the US Geological Survey
The combined station and network codes uniquely identify the location where the data are being recorded.
Component Code
The component code describes the kind of data being recorded. The three alphanumeric characters tells, left to right: a) the sensor’s frequency and digitizing sample rate; b) what sort of instrument is doing the recording (displacement, velocity, or acceleration); and c) the orientation of the sensor. For the purposes of these plots, the second and third characters are the easiest and most important to understand. These are the most common characters in positions 2 and 3 of the 3-character component code:
Instrument:
- Y Displacement (typically GNSS geodetic monuments)
- H, L Velocity (Seismometer)
- N Acceleration (Accelerometer)
Orientation:
- E East-West, horizontal
- N North-South, horizontal
- Z Up-down (aka vertical)
In this example, the channel being plotted is a vertically oriented accelerometer.
Location Code
The last part is a "tiebreaker" that can separate different characteristics at a particular station. One example of use of the location code is to differentiate between multiple sensors that reside at different elevations in a single borehole. Each network operator uses their own codes for identifying the various characteristics.